 (1)
(1)Geomagnetism: The Geometrics G-856 magnetometer utilizes proton precession to measure the magnitude of the geomagnetic field. Breiner (1973) is a general introduction to the instrument and its uses.
The magnetic field is a vector quantity, with magnitude and direction. The difference between the field vector and true north is call the magnetic declination, and the deviation of the field vector from horizontal is called the magnetic inclination. There are four factors that contribute to each magnetic field measurement: the dipole field of the earth, the non-dipole field, the magnetism produced by charged particles in space (diurnal variation) and the effects of man-made objects, electrical machinery, and rocks of the earth’s crust. During any field study, the dipole and non-dipole fields are essentially constant. Subtract these from the measurements and what remains are the diurnal variations plus the effects of the geology and other nearby objects. Diurnal variations are, at times, stronger than anomalies produced by archeological objects. Therefore, it is necessary to measure and subtract diurnal variations from measurements made over the site. Some scientists select a "base" and measure the field at that location from time to time, while others utilize two magnetometers, one for measurements across the site and the other at a fixed location as the base.
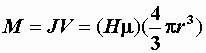
Objects and rocks are magnetized by magnetic induction. When a material is placed inside a magnetic field, magnetic particles line up with the declination and inclination of the applied field. The magnetic field near the object becomes the vector sum of the fields (applied field plus induced field). Magnetic objects, like permanent magnets and the compass, have pole of opposite sign separated by a short distance. The magnetization J induced in the material depends on a property called the magnetic susceptibility (m ) and the magnitude of the applied field (H). The magnetic strength M of the object depends on the magnetization multiplied by the volume. For a sphere of radius r,
(1)
and the anomaly produced is equal to that generated by a magnetic dipole of moment M at the center of the sphere. The amplitude of the anomaly over an object depends on the moment M and the depth to the center of the object. The shape of the anomaly depends on the depth of the object, the inclination of the field H, and generally has both positive and negative values (Fig. 4). A more detailed discussion of the theory can be found here.
Organization of the magnetic survey, Talgua, 1996: We established a baseline due west from the site’s reference monument, placing flags at 1-meter intervals between 14 and 33 meters west. We laid out a second line, parallel with the base, also marked with flags, 40 meters to the north. We extended a metric tape between the first baseline flag and the corresponding flag 40 meters north, extending the tape to a fence (51 meters in all). We walked along this tape, making measurements at 1.0-meter intervals, thus generating a 1.0-meter grid. During a second phase of magnetometer measurements, we made measurements in a survey block south of the baseline (Fig. 5).
We synchronized the magnetometer clocks and set up the magnetometer base station some 50 meters south of the site’s reference monument, away from the area where geophysical exploration and digging were conducted. The base station instrument measured the geomagnetic field every 20 seconds and stored the measurements in the instrument memory. The roving magnetometer was set up in the gradiometer configuration, with one sensor 80 cm above the surface and the other sensor 160 cm above the surface. The instrument is powered by 9 "D" batteries. Alkaline batteries have steel shells, and a set of 9 such batteries affects the sensors even at a distance of 2 meters. Therefore, I use rechargeable batteries with plastic shells. Although the sides of these "D" cells are plastic, the ends are magnetic. It is necessary to separate, as much as possible, the sensors from the batteries. Therefore, 2 persons are needed to make these measurements: one carries the instrument box with batteries, the other carries the sensors 2 meters in front of the instrument box (Fig. 6). The instrument makes 2 measurements at each station, one by the upper sensor, the other by the lower sensor. A pair of measurements requires about 7 seconds. An experienced team can occupy some 5 stations per minute, some 300 stations per hour if too much time is not lost moving the metric tape between profiles.
The data are downloaded from the magnetometers (base and roving) to a computer via cable and the RS-232 port. MAGPAC software (Geometrics, 1988) makes possible calculating diurnal corrections (Fig. 7), separating data collected by the upper sensor from that collected by the lower sensor, and linking site coordinates with measurement values. I use Surfer by Golden Software (Keckler, 1994) to plot contour maps that reveal the results. A geophysicist experienced in using MAGPAC and Surfer needs less than an hour at the computer to process data and plot maps after each day of field work.
Results: Results are shown as maps (Fig. 8). Figure 8a shows that measurements made by the lower sensor show more details than those made by the upper sensor (Fig. 8b). The strongest anomaly is centered near coordinates –17 m east, 31 m north (-17, 31), and has the same shape as an anomaly due to a simple magnetic dipole for this area (Fig. 9). Calculations show that the center of the magnetic dipole must be less than 200 cm under the lower sensor, or less than 140 cm below the surface.
Dr. Chris Begley supervised the excavation seeking the cause of this anomaly. Archaeologists discovered a fire pit (Fig. 10), broken rock surrounded by baked soil. Animal bones (venison?) and sherds were found, but an important discovery in a different excavation unit required the archaeologists’ attention and they did not study this fire pit in detail. The laterite (red soil composed of iron and aluminum oxides) increased its magnetic susceptibility when heated. The mineral hematite (Fe2O3, rhombohedral) to polymorph maghemite (also Fe2O3, crystal form subject to debate) (Lindslay, 1976, p. L-18), a form that returns to its hematite configuration after a long period of time.
The measurement made by one sensor can be subtracted from that made by the other and divided by the distance between them to obtain the gradient of the magnetic field. At times the gradient map reveals details better than the map based on lower sensor data. In Figure 11, the field measured by the lower sensor has been subtracted from that measured by the upper sensor. The dipole at (-17, 31) in Fig. 11a is still the strongest anomaly, but there are also dipoles evident at (-29, 34) and (-28, 44). In Figure 11b, the contour interval has been reduced from 5 gammas/meter to 1 gamma/meter. Now additional dipoles can be seen at (-30, 7), (-17, 10) and (-19, 44). There seems to be a subsurface structure running northwest to southeast between coordinates (-33,27) and (-14, 21).
It is important to complete measurements before excavating. Perturbed soils cause anomalies because soil retains remanent magnetism obtained by sitting in a geomagnetic field for a long time.
We made measurements across some mounds (Area B of Figure 5). The results (Fig. 12, a-c) show more variations than measurements made in the plaza area (Area A of Figure 5), but the anomalies appear related to the topography (Fig. 12d) instead of to buried objects or structures. The task of separating terrain effects from these measurements, in order to observe anomalies caused by buried objects, has not been completed.
Measurements at Site 0L-0020 (Gómez, 1995) shows another topographic anomaly (Fig. 13). When the study area is not horizontal and flat, it is necessary to measure changes in elevation in order to understand if anomalies are due to known or unknown causes.