 Figure
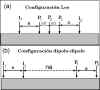
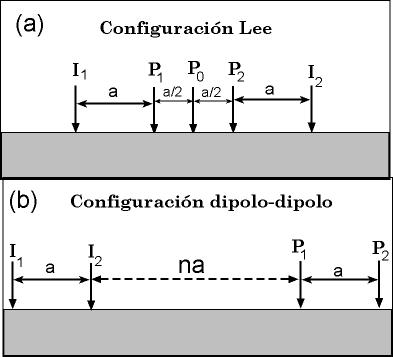
14: Electrical resistivity arrays used at Talgua. Current is injected into
the earth by the I electrodes while the voltage change is measured
between the P electrodes. The separation of the electrodes (a,
a/2, na) enters into the calculation of the apparent resistivity.
Figure
14: Electrical resistivity arrays used at Talgua. Current is injected into
the earth by the I electrodes while the voltage change is measured
between the P electrodes. The separation of the electrodes (a,
a/2, na) enters into the calculation of the apparent resistivity.
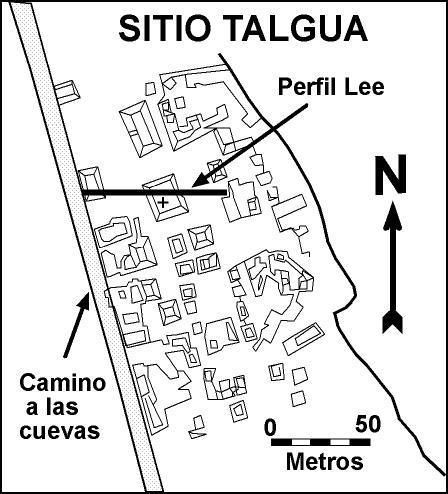
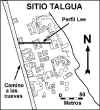 Figure
15: Location of Lee profile at Talgua Village.
Figure
15: Location of Lee profile at Talgua Village.
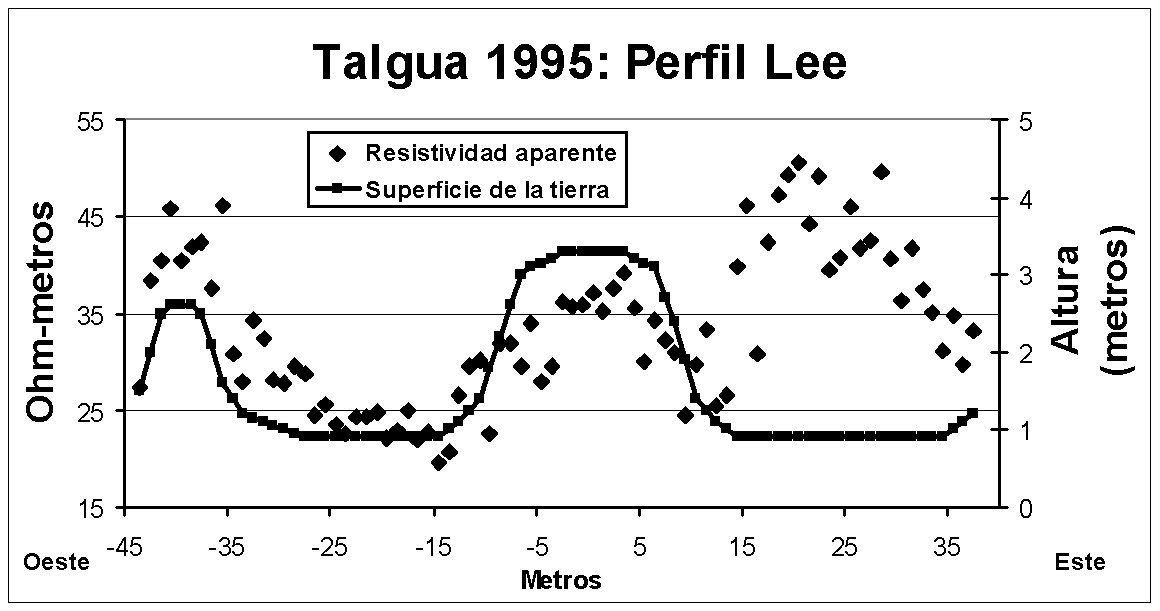
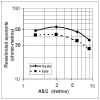
 Figure
16: Results of the Lee profile.
Figure
16: Results of the Lee profile.
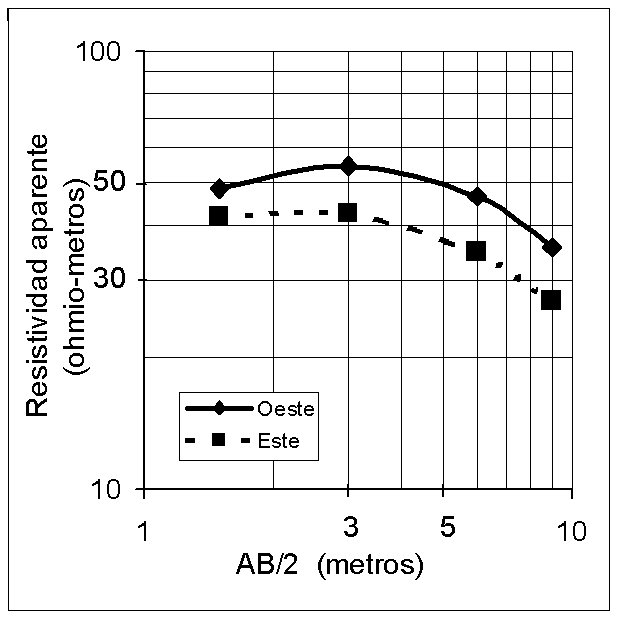
 Figure
17: Soundings, Lee profile.
Figure
17: Soundings, Lee profile.
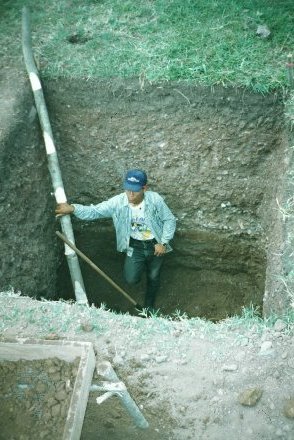
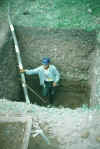 Figure
18: Photo showing gravel fill on top of laterite.
Figure
18: Photo showing gravel fill on top of laterite.
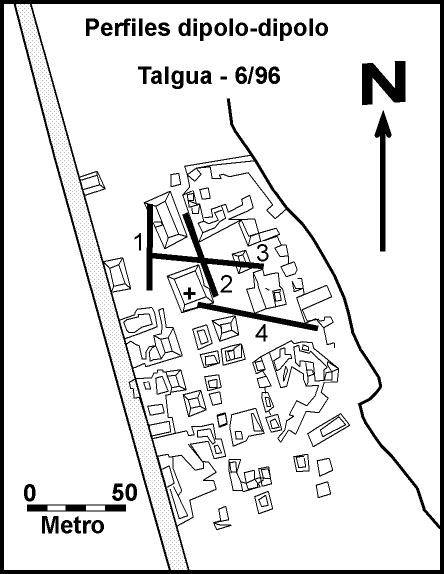
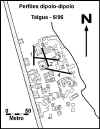 Figure
19: Map showing locations of dipole-dipole profiles.
Figure
19: Map showing locations of dipole-dipole profiles.
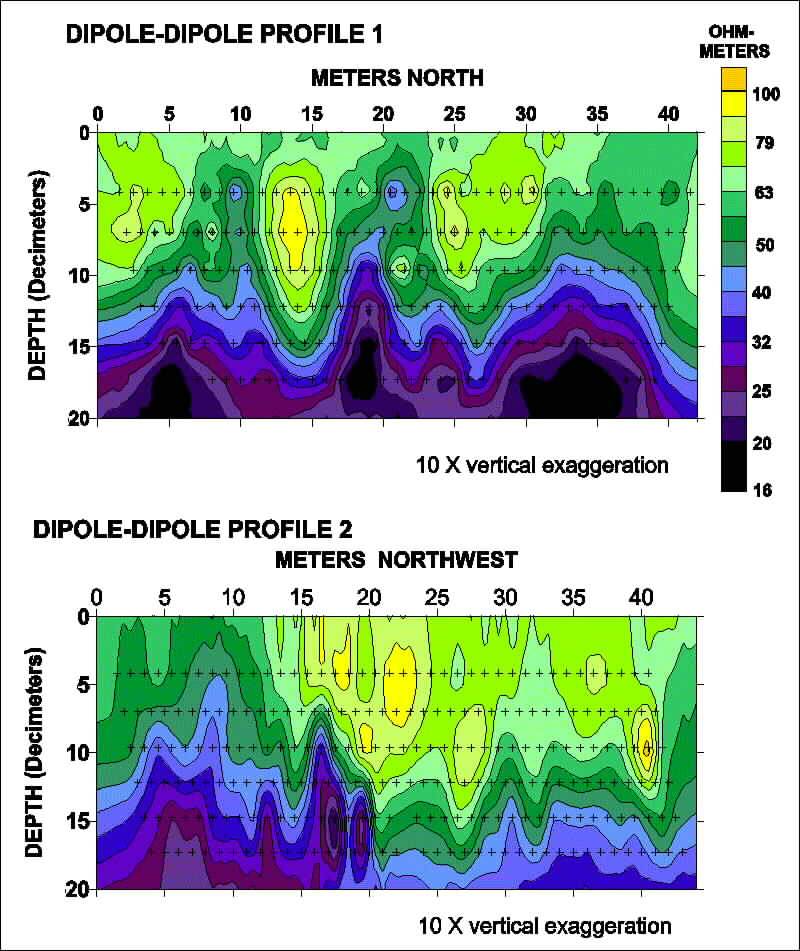
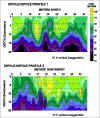 Figure
20: Results: images of subsurface under dipole-dipole profiles 1 and 2.
Figure
20: Results: images of subsurface under dipole-dipole profiles 1 and 2.
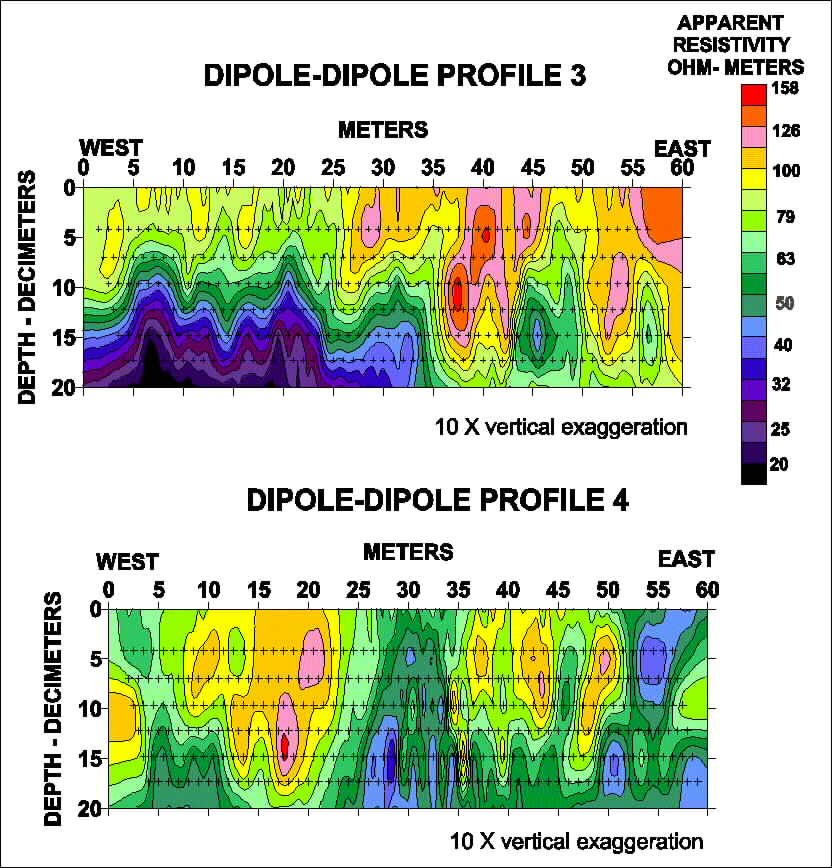
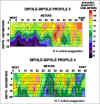 Figure
21: Results: images of subsurface under dipole-dipole profiles 3 and
4.
Figure
21: Results: images of subsurface under dipole-dipole profiles 3 and
4.
Return
to Section 3 of Report

 Figure
14: Electrical resistivity arrays used at Talgua. Current is injected into
the earth by the I electrodes while the voltage change is measured
between the P electrodes. The separation of the electrodes (a,
a/2, na) enters into the calculation of the apparent resistivity.
Figure
14: Electrical resistivity arrays used at Talgua. Current is injected into
the earth by the I electrodes while the voltage change is measured
between the P electrodes. The separation of the electrodes (a,
a/2, na) enters into the calculation of the apparent resistivity.